Multi-bus hardware connectivity
Uses the shared kdp-network-driver to manage CAN, CAN-FD, LIN, and Ethernet channels across Kvaser, PCAN, ZLG, Vector, and related CAN hardware.
Automotive Engineering Tool
A multi-bus measurement and signal monitoring tool for CAN, CAN-FD, LIN, Automotive Ethernet, SOME/IP, SecOC, WebGL signal charts, and BLF recording.
Unify vehicle communication, signal decoding, and measurement recording in one workspace
KITE Pulse is the bus measurement and signal monitoring workstation in the KopherBit KITE family. It opens parallel CAN, CAN-FD, LIN, and Automotive Ethernet channels, decodes traffic through DBC, LDF, and ARXML databases, and coordinates raw trace, decoded signals, Ethernet packet decode, SOME/IP services, and SecOC freshness state in one interface. Recordings are stored as BLF for vehicle network bring-up, SOA / SOME/IP development, SecOC integration, and long-running trace retention.
Uses the shared kdp-network-driver to manage CAN, CAN-FD, LIN, and Ethernet channels across Kvaser, PCAN, ZLG, Vector, and related CAN hardware.
Decodes CAN / LIN / Ethernet PDUs and SOME/IP services through DBC, LDF, and ARXML, then maps byte order, scale, offset, and unit into engineering signals.
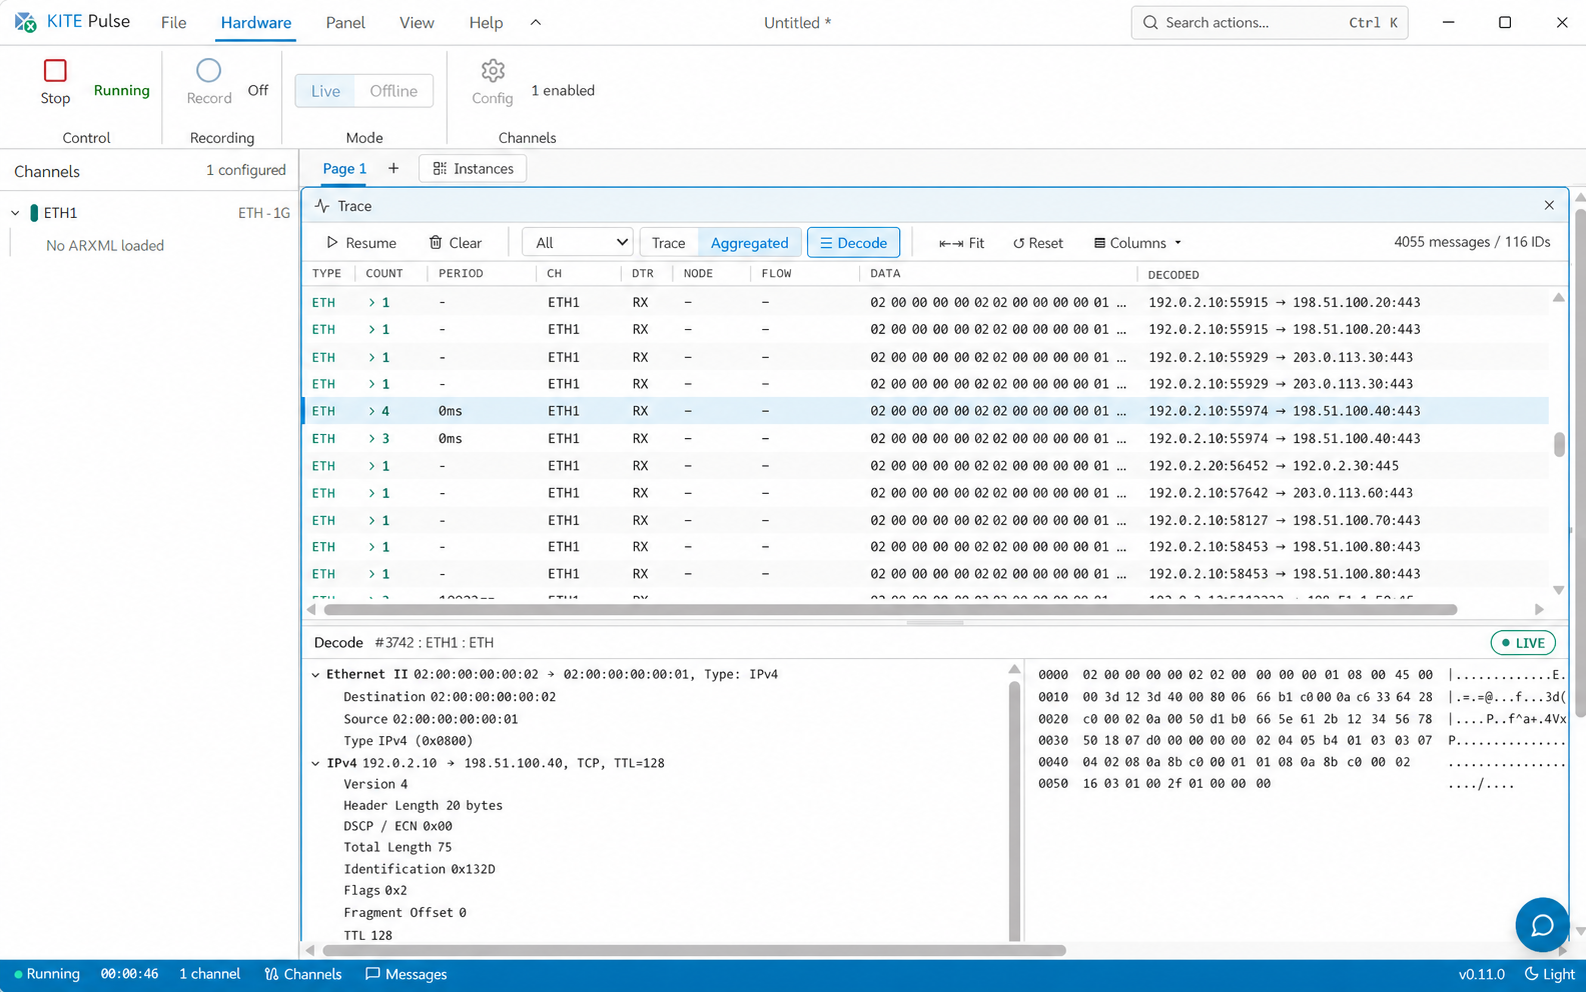
WebGL signal charts support min-max downsampling, dual cursors, and multiple traces, while TracePanel and PacketDecodePanel align raw messages with Ethernet protocol layers.
Covers SOME/IP service discovery, request / response, fire-and-forget, notifications, SecOC MAC / freshness monitoring, and BLF recording with ZLIB compression.
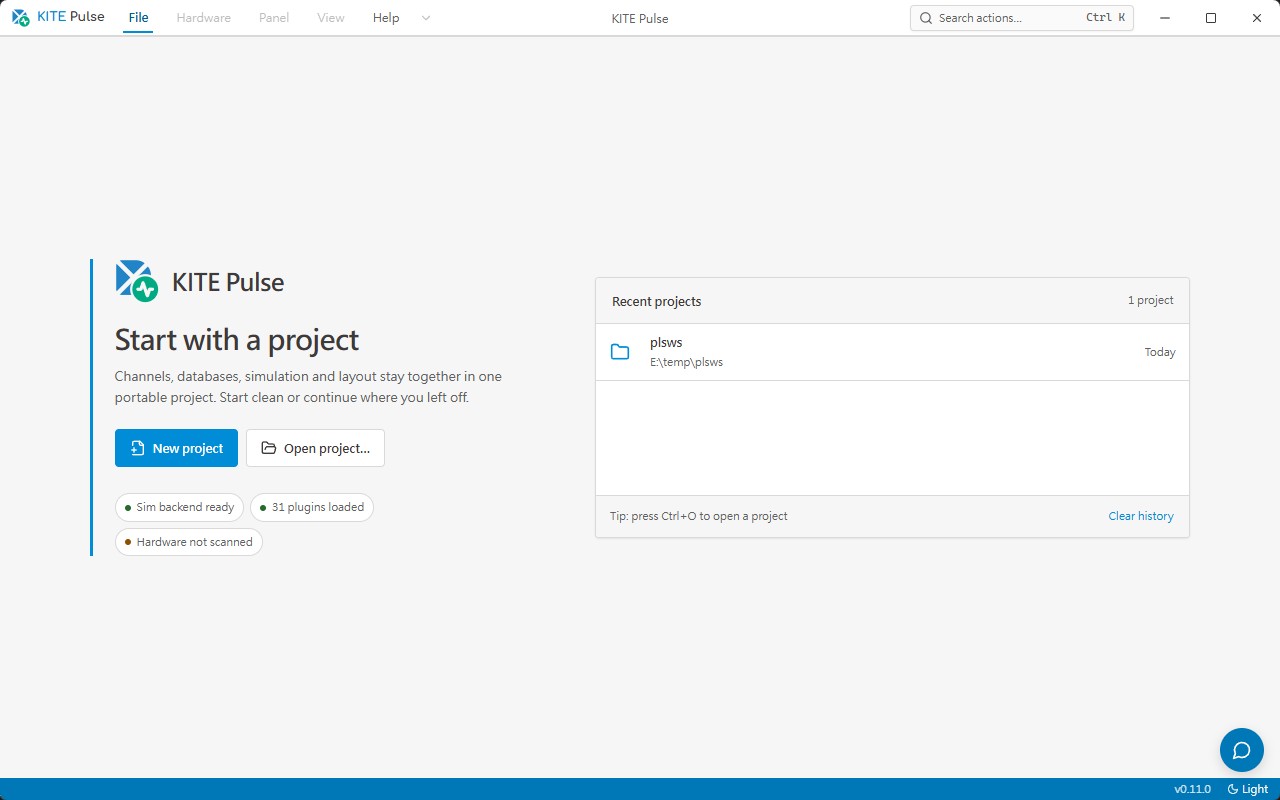
Current KITE Pulse product screens showing the composable workspace and live CAN trace, signals, send, and simulation workflow.
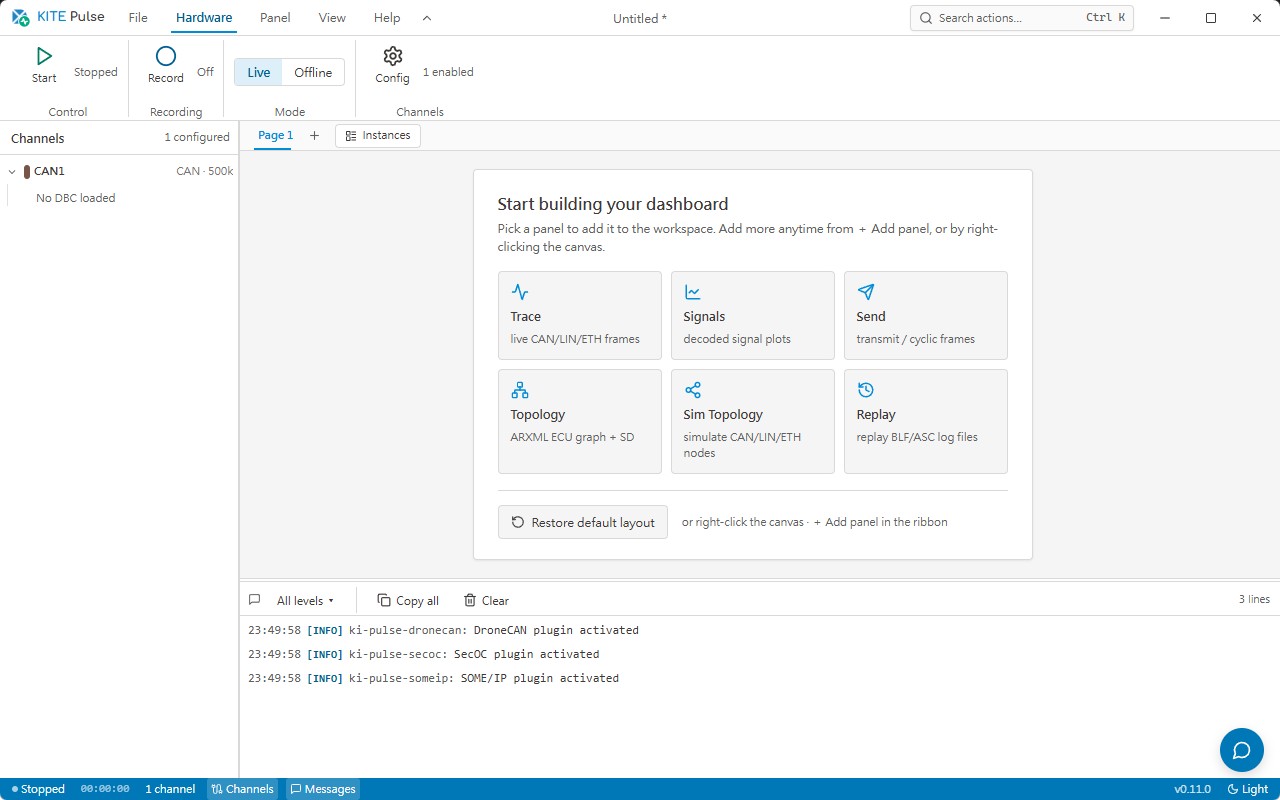
Start from a blank dashboard and add Trace, Signals, Send, Topology, Sim Topology, or Replay panels, then save a workspace for measurement, analysis, or node-simulation tasks.
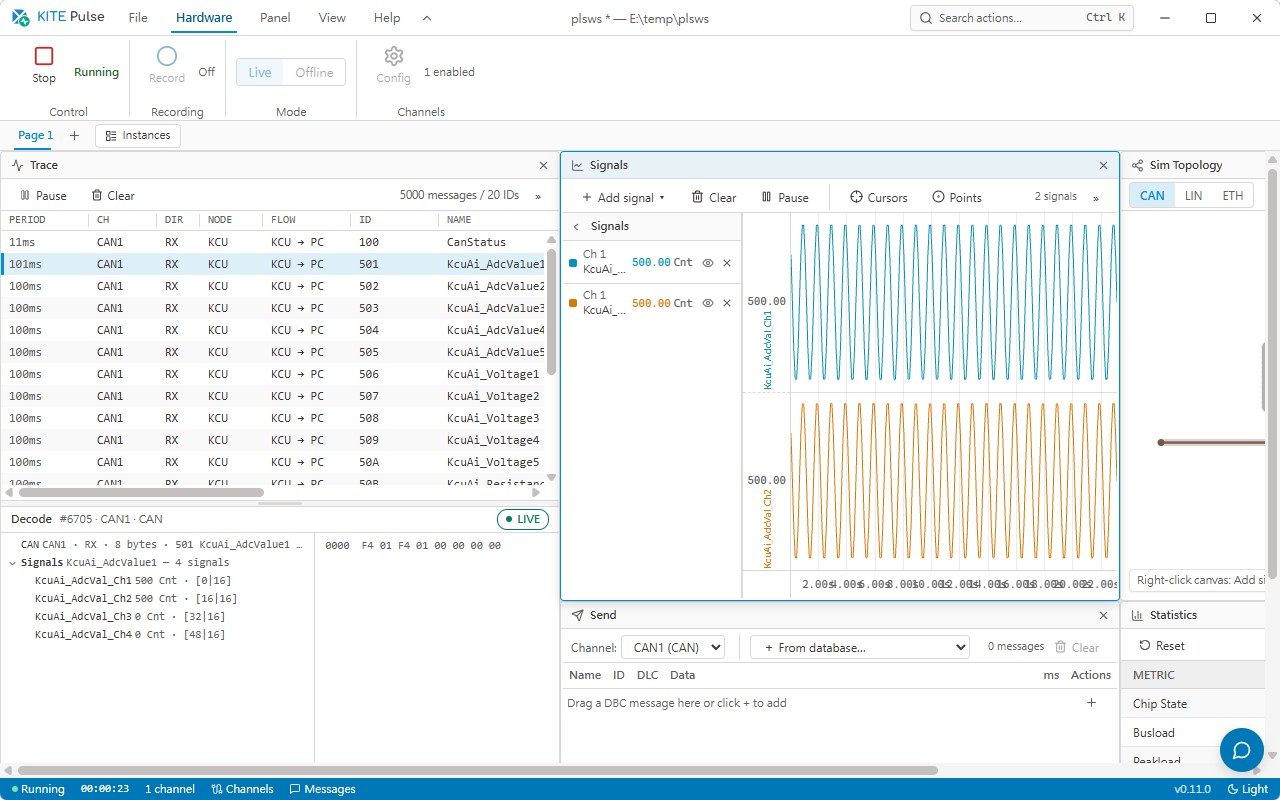
The actual workspace aligns the CAN message list, selected-frame decode, two ADC signal trends, transmit area, simulation topology, and statistics so communication and signal issues can be located on one timeline.
One workspace covers CAN, CAN-FD, LIN, Automotive Ethernet channels, and Kvaser, PCAN, ZLG, Vector CAN hardware interfaces.
DBC / LDF / ARXML databases build a database tree that turns raw frames, PDUs, and SOME/IP services into observable engineering signals.
Includes WebGL signal charts, virtualized trace, Ethernet packet decode, SOME/IP node simulation, SecOC freshness monitoring, and BLF ZLIB recording.
Opens CAN, CAN-FD, LIN, and Ethernet channels through a shared driver layer, with live RX queues and protocol-specific TX commands.
CAN hardware support covers Kvaser, PCAN, ZLG, and Vector, with Kvaser Android USB-CAN JNI integration represented in the source material.
Loads DBC, LDF, and ARXML for signals, frames, schedules, PDUs, and SOME/IP service descriptions, with drag binding into SignalPanel and TracePanel.
SignalPanel uses WebGL rendering, min-max downsampling, dual-cursor delta measurement, and distinct colors for multi-signal monitoring.
TracePanel uses virtual scrolling for high-rate raw messages, while PacketDecodePanel breaks down Ethernet L2 / L3 / L4 / SOME/IP layers with a hex dump.
Covers service discovery, offer / find / subscribe, request / response, fire-and-forget, notifications, and CAN / LIN simulation nodes with cyclic messages.
Manages SecOC MAC keys, freshness values, trip / reset / message counters, and import / export. Recordings are stored as BLF with ZLIB compression and high-precision timestamps.
From database loading and hardware channel setup to raw trace, WebGL signal monitoring, SOME/IP / SecOC inspection, and BLF retention, network issues can be located, compared, and preserved.
Import DBC, LDF, and ARXML to build CAN / LIN signals, Ethernet PDUs, and SOME/IP service definitions.
Select Kvaser, PCAN, ZLG, Vector, or Ethernet channels and verify bus type plus RX / TX state.
Use TracePanel for raw messages and PacketDecodePanel to inspect Ethernet and SOME/IP protocol layers.
Add database-tree signals to the WebGL chart and use dual cursors plus downsampling for signal change analysis.
Check service discovery, request / response, notifications, MAC validation, and freshness counter state.
Save measurements as BLF with ZLIB compression for offline analysis and engineering traceability.
Useful for vehicle network bring-up, ECU communication tests, SOME/IP development, SecOC integration, long-running BLF capture, and test-bench simulation.
Open each bus channel on one workstation and verify messages, schedules, PDU layouts, and timing against vehicle DBC / LDF / ARXML.
Discover and exercise services, simulate clients or servers, and capture request / response, notifications, and service discovery traffic.
Load MAC configuration, check freshness synchronization, and track trip / reset / message counter state.
Record multi-bus traffic with timestamps as BLF for offline analysis and issue traceability.
Drive the SUT through cyclic CAN / LIN simulation nodes and adjust signal values during the test.